For data access, please create a new account or log in .
In order to evaluate and validate the performance of the Hydrologic and Forecasting Model H4SE-HAP, observational data are required. The opportunities to evaluate the model estimates are severely limited by the amount, period of record and spatial distribution of field data (e.g. flux tower observations, soil moisture and streamflow measurements and pan evapotranspiration), and how well they represent the different environments and conditions.
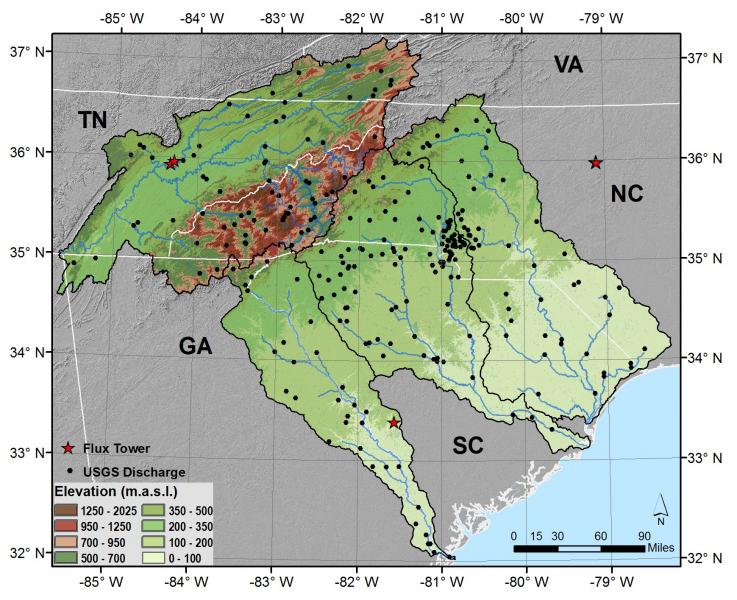
In this section, discharge, flux tower and Pan evapotranspiration measurements are made available to download. The spatial distribution of these data within the geographical domain is shown in figure 1 below, (note this map is still under construction since Pan Evapotranspiration points and other possible data will be added).
Image

USGS discharge data presented in the IPHEX website come from the U.S. Geological Survey's (USGS) National Water Information System (NWIS) . We have included 262 points with discharge data at 15 minute resolution with a generalized common record period from 10/01/2007 till current time. Detailed information on these data is found in the USGS Discharge dataset section.
Flux towers provide continuous observations of ecosystem-level exchanges of carbon dioxide, water, energy and momentum across multiple time-scales.The eddy flux technique allows continuous measurement of the flow of carbon dioxide, water vapor, and other gases just above the forest canopy at a micro-climate level. Flux towers are an integral part of the North American Carbon Program , a multi-agency effort to measure and understand the sources and sinks of Carbon Dioxide, Methane, and Carbon Monoxide in North America and in adjacent ocean regions. The flux towers provide information specific to one ecosystem type or condition. Increasingly, multiple flux towers are installed in contrasting conditions to increase understanding of the effects of different treatments (e.g., harvesting), gradients of vegetation composition, or age chronosequences. Data from flux sites help test and validate physiological models of C exchange and are critical to relating fluxes and Remote Sensing Data. The Ameriflux network manages these data and makes them avalaible through Ameriflux Site and Data Exploration System .
Our geographical domain includes 6 Flux Towers which provide useful observational information for validation purposes. Click Here for the Flux Tower Data.
